Loading 
Bonanza Offer FLAT 20% off & $20 sign up bonus Order Now
The study mainly depicts the significance of forecasting, which could be used by investors to make adequate investment decisions. In addition, the study also helps in evaluating different types of forecasting models, which could be used by investors to increase their return from investment. Furthermore, the study also helps in comparing the return that is generated from USD/AUD with normal distribution method. In addition, the novice by evaluating the current trend in USD/AUD effectively depicts the investment decision, which could be adopted by clients to increase their return. In addition, the novice has effectively used data from 2003 to generated authentic results, which could be helpful in understanding the return distribution trend of USD/AUD.
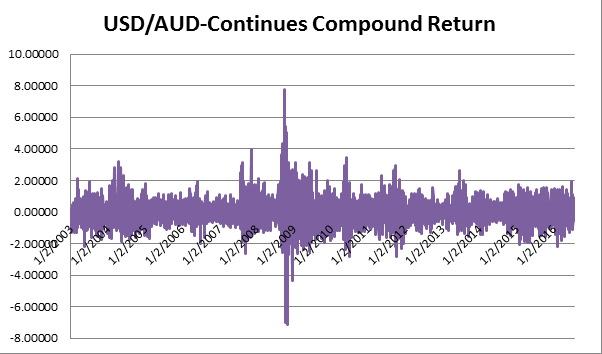
Figure 1: Depicting the continues return of USD/AUD generated from 2003 till date
(Source: Rba.gov.au 2016)
The above figure 1 mainly depicts the overall continuous return, which has been provided by USD/AUD from 2003 to date. In addition, after analysing the overall figure it could be evaluated that USD/AUD has a non-symmetric approach distribution approach. Reboredo (2013) mentioned that stock return are mainly non-symmetric or the basic rule of demand and supply could lose its friction in determining prices of a stock. Thus, it could be concluded that return provided by USD/AUD do not follow normal distribution systems. On the other hand, Ghosh et al. (2013) some inexperienced investors still use statistical distribution method for identifying opportunities in the stock market, which mainly increases their overall risk from investment.
| Mean | -0.00849959 | ||
| SD | 0.84263895 | ||
| Rule | From | To | Number of observations |
| At 68% of the rule | -0.8511385 | 0.834139353 | 2588 |
| At 95% of the rule | -1.6937775 | 1.676778299 | 666 |
| At 97.7% of the rule | -2.5364164 | 2.519417245 | 109 |
| Total | 3363 | ||
Table 1: Depicting the return distribution of USD/AUD using 68-95-99.7 thumb rule
(Source: Rba.gov.au 2016)
The table mainly helps in depicting and comparing the return distribution provided by USD/AUD. Moreover, the above table also helps in depicting the number of observations that that lies under 68-95-99.7 normal thumb rule distribution. In addition, around 2632 observations are under 68% rule, 636 observations are under 95% rule, and only 97 observations are under 97.7% rule. However, the total value used by 68-95-99.7 normal thumb rule is 3363, which is less than the number of observations used in the calculation that is 3406. Moreover, this evidence is sufficient to understand that normal distribution method does not apply to the return distribution provided by USD/ADUD. In addition, the 68-95-99.7 normal thumb rule mainly distributes the data within the range, if it has features of normal distribution. In this context, Hughes and Ferrier (2014) stated that irregular return distribution mainly help investors to use growth model to reduce risk from return. Ardia et al. (2016) further stated that if stock market return is predetermined then the overall trust of investors could be reduced and affect liquidity of the capital market.
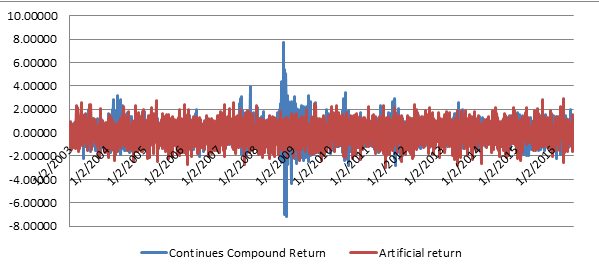
Figure 2: Depicting the different between continues and artificial returns
(Source: Rba.gov.au 2016)
The overall figure 3, mainly depicts the difference between continuous and actual return provided by USD/AUD from 2013 till current data. In addition, the continuous compound return mainly helps in providing adequate calculation of return that is generated from particular security Bollerslev et al. (2014). Furthermore, the continuous return method mainly uses the LN function, which is mainly used in high beta securities to evaluate the risk and overall return generated from volatility. However, normal return just provide values on the basis of probability. Small investors to evaluate the percentage of change in prices of certain stocks use cumulative return calculation method. On the other hand, McLean and Pontiff (2016) criticises that investors uses the return calculation based on its own perception, which increases risk exposure in their portfolio.
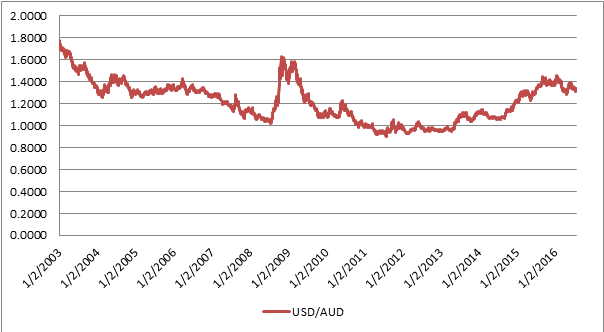
Figure 3: Depicting the current trend of USD/AUD
(Source: Rba.gov.au 2016)
Figure 3 mainly depicts the overall price movement of USD/AUD from 2003 until current date. This figure mainly helps in evaluating the overall strategies, which could be used in making adequate investment for next 30 days. Reboredo (2013) mentioned that investors mainly use historical prices to evaluate the overall trend of the security and make adequate investment decisions. In addition, mean is -0.008499593 and SD is 0.84263895, which mainly helps in depicting that USD/AUD is currently in a downtrend.
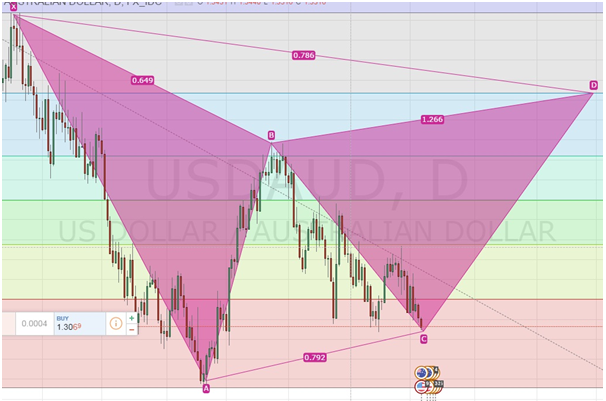
Figure 4: Depicting the current trend of USD/AUD by using harmonic trading strategy
(Source: Tradingview.com 2016)
In addition, figure 4 mainly helps in depicting a harmonic trading strategy, which could be used by the investors to make adequate investment decisions. Furthermore, the Gartley pattern is being formed currently, which might help investor to make adequate return from their investment. In addition, the investor could initiate buy orders at level 1.3061 while keeping the stop loss at 1.2759. Moreover, the investor could also initiate a sell order from 1.4239 with a stop loss of 1.4646. Hughes and Ferrier (2014) mentioned that harmonic trading strategies mainly help investor to detect the overall trend of a security and make adequate investment bets. Thus, combing intuition, statistical valuation, and harmonic strategy the overall USD/AUD is in a downtrend.
| Regression Statistics | |
| Multiple R | 0.308344642 |
| R Square | 0.095076418 |
| Adjusted R Square | 0.062757719 |
| Standard Error | 0.011841204 |
| Observations | 30 |
| ANOVA | ||||||||
|
| df | SS | MS | F | Significance F | |||
| Regression | 1 | 0.000412487 | 0.000412 | 2.941839 | 0.097361 | |||
| Residual | 28 | 0.003925995 | 0.00014 | |||||
| Total | 29 | 0.004338483 |
|
|
| |||
|
| Coefficients | Standard Error | t Stat | P-value | Lower 95% | Upper 95% | Lower 95.0% | Upper 95.0% |
| Intercept | 1.3348033 | 0.002171362 | 614.7309 | 2.24E-59 | 1.330355 | 1.339251 | 1.330355 | 1.339251 |
| X Variable 1 | 0.005799303 | 0.003381165 | 1.715179 | 0.097361 | -0.00113 | 0.012725 | -0.00113 | 0.012725 |
Table 2: Depicting the hypothesis calculation for analysing trend of USD/AUD
(Source: Rba.gov.au 2016)
Table 2, mainly helps in depicting the hypothesises calculation, which are used to make adequate investment decisions. Moreover, the overall hypothesis calculation mainly helps in depicting the initiation of Sell Side trades, which could be conducted by investors. In addition, the overall hypothesis valuation is only conducted on past 30 days to determine the opportunity in short trend, which could be used by the investors. Moreover, the standard error is 0.011841204 mainly depicts the overall continuation of downtrend in USD/AUD. Bollerslev et al. (2014) mentioned that hypothesis mainly helps investors to make adequate assumption, which might reduce risk from investments.
The continuous return provided from FX market could be effectively evaluated from different types of different types of hypothesis and return calculation. Moreover, after evaluating the continuous return generated from 2003 to 2016, it could be conducted that there are no significant return provided to the investors. FX market does not have huge fluctuations, which might affect directly on the return provide from different currencies. In addition, with the help of ‘Autoregressive of order 1 model’ and ‘Random Walk Model’ the investors effectively derive the future price movement of USD/AUD. In addition, Autoregressive of order 1 model mainly adds intercept and variable value, which can be effectively multiplied with the present day’s closing price. Zhang et al. (2013) mentioned that forecasting method mainly helps in depicting future trends, which might help in reducing the overall risk of investment.
Evaluating Autoregressive of order 1 model
| Autoregressive of order 1 model | RMSE | MAE | MSE | ||
| 0.026483887 | -0.0258 | 0.00070 | |||
| Period | A | F | SQ error | Abs | Error(A-F) |
| 7/15/2016 | 1.311303436 | 1.340891409 | 0.000875448 | 0.029587973 | -0.029587973 |
| 7/18/2016 | 1.315789474 | 1.338253936 | 0.000504652 | 0.022464462 | -0.022464462 |
| 7/19/2016 | 1.328197636 | 1.342832173 | 0.00021417 | 0.014634537 | -0.014634537 |
| 7/20/2016 | 1.333155579 | 1.355495353 | 0.000499065 | 0.022339774 | -0.022339774 |
| 7/21/2016 | 1.335648457 | 1.360555194 | 0.000620346 | 0.024906737 | -0.024906737 |
| 7/22/2016 | 1.337613697 | 1.363099307 | 0.000649516 | 0.02548561 | -0.02548561 |
| 7/25/2016 | 1.336005344 | 1.365104937 | 0.000846786 | 0.029099593 | -0.029099593 |
| 7/26/2016 | 1.329256945 | 1.363463529 | 0.00117009 | 0.034206583 | -0.034206583 |
| 7/27/2016 | 1.336541032 | 1.356576434 | 0.000401417 | 0.020035402 | -0.020035402 |
| 7/28/2016 | 1.328903654 | 1.364010226 | 0.001232471 | 0.035106572 | -0.035106572 |
Table 3: Depicting the forecasting method of Autoregressive of order 1 model
(Source: Rba.gov.au 2016)
Evaluating Random Walk Model
| Random Walk Model | MSE | RMSE | MAE | ||
| 0.00042 | 0.020390349 | 0.0180 | |||
| Period | A | F | Abs | SQ error | Error(A-F) |
| 7/15/2016 | 1.311303 | 1.313400178 | 0.00209674 | 4.39633E-06 | -0.0020967 |
| 7/18/2016 | 1.315789 | 1.312912562 | 0.00287691 | 8.27662E-06 | 0.00287691 |
| 7/19/2016 | 1.328198 | 1.312424945 | 0.01577269 | 0.000248778 | 0.01577269 |
| 7/20/2016 | 1.333156 | 1.311937329 | 0.02121825 | 0.000450214 | 0.02121825 |
| 7/21/2016 | 1.335648 | 1.311449713 | 0.02419874 | 0.000585579 | 0.02419874 |
| 7/22/2016 | 1.337614 | 1.310962097 | 0.0266516 | 0.000710308 | 0.0266516 |
| 7/25/2016 | 1.336005 | 1.310474481 | 0.02553086 | 0.000651825 | 0.02553086 |
| 7/26/2016 | 1.329257 | 1.309986864 | 0.01927008 | 0.000371336 | 0.01927008 |
| 7/27/2016 | 1.336541 | 1.309499248 | 0.02704178 | 0.000731258 | 0.02704178 |
| 7/28/2016 | 1.328904 | 1.309011632 | 0.01989202 | 0.000395693 | 0.01989202 |
Table 4: Depicting the forecasting method of Random Walk Model
(Source: Rba.gov.au 2016)
Table 3 and 4 mainly helps in depicting ‘Autoregressive of order 1 model’ and ‘Random Walk Model’, which could be used in forecasting future trends of USD/AUD. In addition, the Random walk model is appropriate and has positive values of MSE, RMSE, and MAE. However, Autoregressive of order 1 model has a negative MAE, which might hamper the overall forecasting of USD/AUD. In addition, while calculating difference between forecasting and actual prices, RWM has mainly depicted the closest prediction, which could be used in generating higher return from investment. Yontay et al. (2013) argued that due to continuous volatility, the predicted prices only depict the overall trend, which in turn increases risk of the investors.
| Particulars | Value |
| Portfolio Value | 1000000 |
| Average Return | -0.037383246 |
| Standard Deviation | 0.000405447 |
| Confidence Level | 0.99 |
| Calculations | |
| Min Return with 99% probability | -0.038326457 |
| Value of Portfolio | 961673.5430 |
| Value at Risk | 38326.4570 |
| Risk at percentage | 3.83% |
Table 5: Depicting the Parametric method for evaluating investment risk
(Source: Rba.gov.au 2016)
In addition, with the help of parametric method the overall risk from investment is calculated at $38326.4570. This mainly indicates that by using parametric method, investment of 1 million USD will have around 3.83% of risk. Thus, volatility of the financial market could mainly increase the overall risk implications for the next 90 days. Moralles et al. (2013) during an economic crisis, predictive prices could lose its friction and increase risk of the overall portfolio.
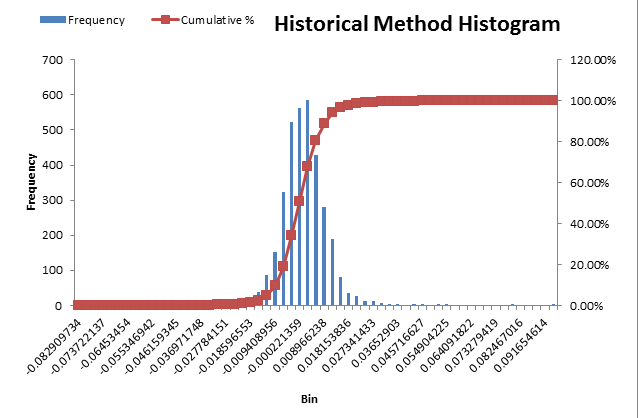
Figure 5: Depicting the Historical method for evaluating investment risk
(Source: Rba.gov.au 2016
Furthermore, with the help of figure 5, the historical simulated method could be effectively analysed. Furthermore, the overall risk ranges from 0.08909734 to 0.091654614, which effectively depicts the maximum and minimum return that could be generated from 1 million USD investments (Lu et al. 2013). In addition, the maximum risk is only within -0.009408956 to 0.018153836, which could affect the overall investment risk of 1 Million USD.
The assignment mainly helps in evaluating different type of investment strategies, which could be used by investors to make adequate investment decisions. Furthermore, Random Walk Model is depicted as the appropriate forecasting method, which might be used by investors to make adequate investment decisions. In addition, the novice has effectively depicted the overall risk evaluation that could be conducted by parametric and historical simulation method. Lastly, the study also portrays the current trend of USD/AUD by using harmonic, and hypothesis method.
Ardia, D., Gatarek, L.T., Hoogerheide, L. and van Dijk, H.K., 2016. Return and Risk of Pairs Trading Using a Simulation-Based Bayesian Procedure for Predicting Stable Ratios of Stock Prices. Econometrics, 4(1), p.14.
Bollerslev, T., Marrone, J., Xu, L. and Zhou, H., 2014. Stock return predictability and variance risk premia: statistical inference and international evidence. Journal of Financial and Quantitative Analysis, 49(03), pp.633-661.
Ghosh, A.R., Ostry, J.D. and Qureshi, M.S., 2013. Fiscal space and sovereign risk pricing in a currency union. Journal of International Money and finance, 34, pp.131-163.
Hughes-Morgan, M. and Ferrier, W.J., 2014. Competitive Action Repertoires and Stock Risk. Journal of Managerial Issues, 26(1), p.55.
Lu, Y., Ren, P. and Gu, Z., 2013. The Statistical Difference of Chinese Stock Market Risk before and after the Stock Index Futures Based on VAR Method. International Journal of Business and Management, 8(14), p.182.
McLean, R.D. and Pontiff, J., 2016. Does academic research destroy stock return predictability?. The Journal of Finance, 71(1), pp.5-32.
Moralles, H.F., do Nascimento Rebelatto, D.A. and Sartoris, A., 2013. Parametric VaR with goodness-of-fit tests based on EDF statistics for extreme returns. Mathematical and Computer Modelling, 58(9), pp.1648-1658.
Rba.gov.au, (2016). Available from: http://www.rba.gov.au/statistics/historical-data.html#exchange-rates [Accessed on 23 Jul. 2016].
Reboredo, J.C., 2013. Is gold a safe haven or a hedge for the US dollar? Implications for risk management. Journal of Banking & Finance, 37(8), pp.2665-2676.
Tradingview.com. (2016). New Chart - TradingView. Available from: https://www.tradingview.com/chart/?symbol=USDAUD [Accessed on 5 Aug. 2016].
Yontay, P., Weiß, C.H., Testik, M.C. and Pelin Bayindir, Z., 2013. A Two?Sided Cumulative Sum Chart for First?Order Integer?Valued Autoregressive Processes of Poisson Counts. Quality and Reliability Engineering International, 29(1), pp.33-42.
Zhang, Z., Zeng, D.D., Abbasi, A., Peng, J. and Zheng, X., 2013. A random walk model for item recommendation in social tagging systems. ACM Transactions on Management Information Systems (TMIS), 4(2), p.8.
MyAssignmenthelp.co.uk is a name in assignment writing services that students trust. We offer our assignment writing services for a wide variety of assignment including essays, dissertations, case studies and more. Students can place their order with us anytime as we function 24x7, and get their copies at unbeatable prices. We guarantee that all of our solutions are plagiarism-free.
Upload your Assignment and improve Your Grade
Boost Grades


