Loading 
Bonanza Offer FLAT 20% off & $20 sign up bonus Order Now
Discuss about the Principals of Financial Markets Group.
Businesses have to check their financial standing regularly in order to ensure they are aware of challenges to their financial positions or to track losses in productivity and efficiency etc. The purpose of financial analysis hence is to examine a business from multiple viewpoints which would enable the business proprietor and related stakeholders to understand its financial situation. Multiple viewpoints are necessary, as the business will not just suffer from impact of its internal situations, but also from macro-environmental external situations as well. So a financial analysis will have to be done across both perspectives.
Given this background context, the purpose of this research is to choose the food manufacturing industry for analysis. Tow companies chosen in research here are Bega Cheese and Warrnambool Cheese and Butter Factory. The analysis proceeds in two steps. Primarily, the external economic environmental analysis is done and secondly, a fundamental bottom up analysis of the company, its financial growth, its history and more is analyzed.
Bega Cheese manufacturing company (ASX Code: BGA) situated in New South Wales and Victoria deals with the manufacturing of different varieties of cheese and has been in production for the past 100 years. While cheese is the main product sold, whey powder manufactory is also done here. Typically, one of its production units manufactures around 14,000 mt of cheddar and 7,000 mt of demineralised whey powder in a financial year. In addition to the production of wholesale selling products such as Tatura Milk, Bega cheese also attempts to educate the society with respect to chees and its heritage or cultural associations with the place (Bega, 2016). The mission of the company as observed from its site to be a strong part of the heritage connections with food products and the company aims to provide high quality products to its consumers.
The Warrnambool Cheese and Butter (ASX Code: WCB) is a butter and cheese factory. It is an Australian based enterprise but with majority shareholdings by Saputo Inc which is a Canadian company and holds around 87.92 per cent of the WCB shares (Smith, 2015). Warrnambool works with the mission to provide everyday ranges of cheese and butter at really low prices. It manufactures and sells different varieties of dairy products such as cheese, butter, cream and more. The company sells nearly a half of its products to foreign nations. Some of its more local brands are that of Coon cheese, the Cracker Barrel, Warrnambool cheddar cheese and more. The company is older than Bega Cheese and was established as a business in Allansford, Victoria, in 1888.
The purpose of the top down analysis is to understand the economic environment in which the company operations and also how it finances and sales could be affected by it. Now the macro economic environment can be considered from two ends, the country’s economic environment and the global economy and impact.
The Global economic growth has picked up in the last few years following the economic recessions of the decade. This is a positive point for all industries globally speaking. The economic growth was 3.4 percent in 2014 and this was an improvement compared to the 2013 growth which was recorded at 3.3 percent only. While GDP growth rates are diversified, such as China having faster GDP growth, and other nations such as India, Japan and the United States following second, an overall GDP increase has been observed and this is a good trend for industrial growth in general and companies in specific.
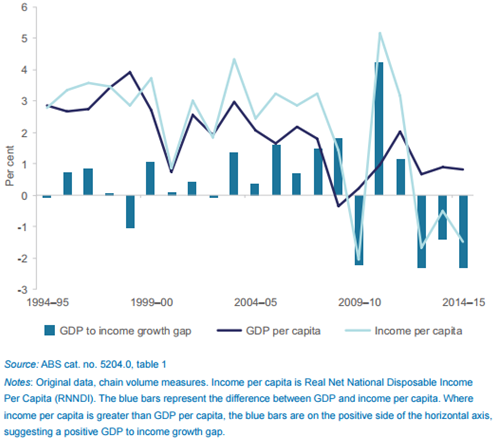
The Gross domestic product (GDP) of the country is calculated on annual basis or quarterly basis and is considered as the monetary value of all the finished goods and services produced in a country per annum or quarter. The GDP is used to calculate the country’s economic health and as such is usually even considered as the size of the economy. In understanding the country’s economic growth, a comparison with the previous year’s GDP is usually drawn. GDP is usually calculated by measurement of adding up every employed person’s earning in a year within the country or could also be calculated by adding what everybody spent in a year. In a logical sense, both income approach and the expenditure approach must tally at the same amount. In Australia, the Gross domestic product calculated for 2015 was 1339.54 billion US dollars. Now this value is almost 2.16 percent of the entire world economy. An all-time high in GDP was reached in 2015. The GDP value of Australia represents 2.16 percent of the world economy. GDP in Australia averaged 386.58 USD Billion from 1960 until 2015 and the all-time high in GDP was represented in the year 2013. Now although 2015 records as a growth area, the rate of growth has declined leading to a new normal growth rate. The growth with respect to income per capita has decreased as well. It can hence be said Australia has moved aware from its high investment resources phase. Now if that is the context of the economic environment within the country as understood based on GDP, then the businesses also have to be careful in investments as such.
Source: Australian Government, 2015
Companies which involve in a high amount of trading with outside nations suffered from the issues of economic recessions. There are flux domestic conditions seen in countries such as China even as of 2016 and China is one of the major trading partner of Australia. China had a high value of economic growth in the past, but in current times as of 2015 China’s economic growth is slowing down. It is moderating down and eased down to below 7 percent in annual growth, and in more current times could slow down more as total debt to savings in terms of GDP has increased two fold as of 2014 (Australian Government, 2015). It was 100 percent of GDP in 200 and not it around 200 percent of GDP. High debt hence challenges the economic growth of the country to a certain extent leading to market volatility. This would have an impact on its export and import trades. Now since companies such as Warrnambool Cheese is seen to be selling more than 50 percent of its products in such flux conditions, the company has to be careful in its foreign dealings.
Australia’s real and nominal, trade weighted exchange rate is on the decline. Exchange rate or the foreign exchange rate as defined in finance and transactions between two countries. It is the rate at which one country’s currency can be exchanged for another. Yet another way to consider it is to regard it as one country’s currency value defined in relation to another. The nominal trade weighted exchange rate is defined as a weighted geometric average. It is calculated as the average value of Australian currency in relations to the currencies of the trading partners of the country. On the other hand, the real trade-weighted exchange rate is defined as the same average value that has been adjusted for the relative price levels. From 2014-2015 it has been observed that there is a decline in both these values (Australian Government, 2015). What this decline means is that most of the exporting industries would now be able to consider new export sources given that the pressure is off them now. Since the Australian dollar is low, export competitiveness can be increased as exports could be sold for adjusted prices in foreign nations or companies can find newer export partners. A lower Australian dollar improves export competitiveness by allowing exports to be sold for less in foreign currencies. Companies such as Warrnambool Cheese which is heavily invested in exporting (exporting to around 50 percent of its goods) will benefit from this low Australian dollar environment.
The Food, beverage and tobacco industry of which, the companies Bega Cheese and Warrnambool Cheese and Butter Factory are part of, is considered as a strong sector within Australia. It accounts for around 25.5 percent share of the entire GDP of the country and has a value of around $25.4 billion. It plays a major role in the Australian economy as it supports around 22.9 percent of the manufacturing labor force in the country and to this extent it also has much political and policy based support (Australian Government, 2015). There are Government backed up support for this industry as a result of this. Government backed institutions and production process facilitations are present for the industry. The Government support has led to an increase in productivity gain of around two percent. In addition to the direct support, the food and beverage industry is also provided support in the form of research. Australia’s food and beverage industry has a number of education and training facilities in its midst. Cutting edge research on food manufacturing is done here and most of the people working in the sector are highly trained or have some amount of exposure. International food companies hence draw on these strengths. Some of the institutions that are hence helpful for improving economic productivity of Bega Cheese and Warrnambool Cheese and Butter Factory are that of the Food Science Australia Research and Development Institution and the Dairy Cooperative Research Centre.
Some of the key internal elements that can be used in the bottom up analysis are that of accounting rations and profitability rations.
The accounting ratio can be calculated for the companies, it is also called as the financial ratio and plays a proper role in financial analysis of a company. Usually accounting ratio works by relating a financial statement to another.
| Financials | 2012-06 | 2013-06 | 2014-06 | 2015-06 | 2016-06 |
| Revenue AUD Mil | 927 | 1,010 | 1,069 | 1,113 | 1,196 |
| Gross Margin % | 12.4 | 13.4 | 11.1 | 10.9 | 12.8 |
| Operating Income AUD Mil | 27 | 35 | 24 | 12 | 36 |
| Operating Margin % | 2.9 | 3.5 | 2.2 | 1.1 | 3 |
| Net Income AUD Mil | 18 | 25 | 66 | 12 | 29 |
| Earnings Per Share AUD | 0.13 | 0.17 | 0.43 | 0.08 | 0.19 |
| Dividends AUD | 0.04 | 0.1 | 0.11 | 0.12 | 0.13 |
| Payout Ratio % | — | 65.6 | 58 | 34.7 | 89.3 |
| Shares Mil | 137 | 153 | 153 | 153 | 153 |
| Book Value Per Share AUD | 1.62 | 1.7 | 2.09 | 2.04 | 2.1 |
| Operating Cash Flow AUD Mil | -11 | 62 | 40 | -17 | 59 |
| Cap Spending AUD Mil | -28 | -28 | -28 | -19 | -40 |
| Free Cash Flow AUD Mil | -38 | 34 | 13 | -36 | 19 |
| Free Cash Flow Per Share AUD | — | 0.03 | 0.2 | -0.22 | 0.08 |
| Working Capital AUD Mil | 99 | 115 | 109 | 149 | 137 |
Table: 1 – Financial Ratios for Bega Cheese for last 5 years (Source: finance.yahoo.co.au)
| Financials | ||||||||||
| 2006 | 2007 | 2008 | 2009 | 2010 | 2011 | 2012 | 2013 | 2014 | 2016 | |
| Revenue AUD Mil | 349 | 365 | 510 | 461 | 417 | 499 | 493 | 497 | 610 | 642 |
| Gross Margin % | 17.9 | 19.9 | 14.7 | 14.2 | 23.4 | 21 | 18.3 | 24 | 23.7 | 22.5 |
| Operating Income AUD Mil | 6 | 10 | 8 | -13 | 16 | 15 | -2 | 14 | 28 | -2 |
| Operating Margin % | 1.7 | 2.8 | 1.5 | -2.9 | 3.9 | 3 | -0.5 | 2.8 | 4.6 | -0.4 |
| Net Income AUD Mil | 8 | 10 | 25 | -20 | 9 | 18 | 15 | 7 | 21 | 4 |
| Earnings Per Share AUD | 0.14 | 0.17 | 0.44 | -0.45 | 0.2 | 0.36 | 0.26 | 0.13 | 0.36 | 0.07 |
| Dividends AUD | 0.1 | 0.08 | 0.13 | 0.29 | 0.03 | 0.16 | 0.2 | 0.15 | 0.15 | |
| Payout Ratio % * | 142.6 | 28.8 | 13 | 43.3 | 231.6 | 37.5 | ||||
| Shares Mil | 55 | 56 | 56 | 44 | 44 | 51 | 58 | 59 | 59 | 60 |
| Book Value Per Share * AUD | 1.87 | 2.21 | 2.18 | 2.3 | 2.65 | 3.09 | 2.92 | 3.17 | ||
| Operating Cash Flow AUD Mil | 19 | 18 | 6 | -22 | 8 | 47 | -7 | 1 | 46 | -12 |
| Cap Spending AUD Mil | -14 | -9 | -10 | -19 | -6 | -8 | -15 | -23 | -23 | -19 |
| Free Cash Flow AUD Mil | 4 | 9 | -4 | -41 | 2 | 39 | -22 | -22 | 23 | -31 |
| Free Cash Flow Per Share * AUD | 0.14 | -0.07 | -0.93 | 0.05 | 0.76 | 0.18 | -0.8 | 0.15 | ||
| Working Capital AUD Mil | 28 | 31 | 47 | 2 | 11 | 57 | 61 | 50 | 52 | 147 |
Table: 2 – Financial Ratios for Warrnambool Cheese and Butter Factory Co Holdings Ltd (Source: finance.yahoo.co.au)
The company’s return on investment is given by its profitability rations. The profitability ratios are used to understand the capability of the company to generate profits from its operations and hence a more futuristic planning is possible from the financial analysis. ROI in inventory and other assets can also be understood for the company.
| Margins % of Sales | 2012-06 | 2013-06 | 2014-06 | 2015-06 | 2016-06 |
| Revenue | 100 | 100 | 100 | 100 | 100 |
| COGS | 87.55 | 86.62 | 88.94 | 89.12 | 87.18 |
| Gross Margin | 12.45 | 13.38 | 11.06 | 10.88 | 12.82 |
| SG&A | 19.58 | 19.03 | 18.07 | 19.14 | 6.26 |
| R&D | — | — | — | — | — |
| Other | -10.06 | -9.13 | -9.23 | -9.36 | 3.53 |
| Operating Margin | 2.93 | 3.48 | 2.21 | 1.1 | 3.03 |
| Net Int Inc & Other | -0.01 | 0.02 | 6.54 | 0.38 | 0.3 |
| EBT Margin | 2.92 | 3.5 | 8.75 | 1.48 | 3.34 |
| Profitability | 2012-06 | 2013-06 | 2014-06 | 2015-06 | 2016-06 |
| Tax Rate % | 24.56 | 28.02 | 29.41 | 24.5 | 27.87 |
| Net Margin % | 1.89 | 2.52 | 6.18 | 1.12 | 2.41 |
| Asset Turnover (Average) | 1.8 | 1.89 | 1.94 | 2.02 | 2.1 |
| Return on Assets % | 3.4 | 4.77 | 12.01 | 2.25 | 5.05 |
| Financial Leverage (Average) | 2.09 | 2.11 | 1.75 | 1.77 | 1.79 |
| Return on Equity % | 7.11 | 10.01 | 22.92 | 3.96 | 8.99 |
| Return on Invested Capital % | 6.69 | 8.53 | 19.87 | 4.16 | 8.13 |
| Interest Coverage | 3.94 | 5.18 | 15.64 | 5.51 | 11.4 |
Table: 3– Bega Cheese profitability ratio (Source: finance.yahoo.co.au)
| Key Ratios -> Profitability | ||||||||||
| Margins % of Sales | 2006 | 2007 | 2008 | 2009 | 2010 | 2011 | 2012 | 2013 | 2014 | 2016 |
| Revenue | 100 | 100 | 100 | 100 | 100 | 100 | 100 | 100 | 100 | 100 |
| COGS | 82.07 | 80.09 | 85.28 | 85.79 | 76.63 | 78.96 | 81.72 | 76.04 | 76.31 | 77.47 |
| Gross Margin | 17.93 | 19.91 | 14.72 | 14.21 | 23.37 | 21.04 | 18.28 | 23.96 | 23.69 | 22.53 |
| SG&A | 8.31 | 8.12 | 6.49 | 8.36 | 9.69 | 8.6 | 9.25 | 10.11 | 10.58 | 12.41 |
| R&D | 0.7 | 0.49 | 0.18 | |||||||
| Other | 7.92 | 8.96 | 6.76 | 8.74 | 9.79 | 9.44 | 9.52 | 10.31 | 7.98 | 10.29 |
| Operating Margin | 1.7 | 2.83 | 1.47 | -2.89 | 3.89 | 3 | -0.49 | 2.83 | 4.63 | -0.35 |
| Net Int Inc & Other | 1.47 | 0.97 | 5.01 | -3.63 | -1.56 | 1.96 | 4.49 | -0.9 | 0.1 | 0.8 |
| EBT Margin | 3.17 | 3.8 | 6.48 | -6.52 | 2.33 | 4.97 | 3.99 | 1.93 | 4.73 | 0.45 |
| Profitability | ||||||||||
| Tax Rate % | 31.49 | 30.69 | 25.95 | 9.13 | 25.43 | 22.86 | 21.91 | 26.29 | ||
| Net Margin % | 2.17 | 2.64 | 4.8 | -4.33 | 2.11 | 3.7 | 3.08 | 1.51 | 3.49 | 0.66 |
| Asset Turnover (Average) | 1.99 | 2.01 | 2.39 | 1.94 | 1.74 | 2.01 | 1.88 | 1.71 | 1.97 | 1.16 |
| Return on Assets % | 4.33 | 5.3 | 11.48 | -8.39 | 3.67 | 7.44 | 5.78 | 2.58 | 6.89 | 0.76 |
| Financial Leverage (Average) | 1.87 | 1.81 | 1.94 | 2.42 | 2.41 | 1.66 | 1.71 | 1.89 | 1.69 | 2.39 |
| Return on Equity % | 8.07 | 9.74 | 21.62 | -18.05 | 8.86 | 14.59 | 9.72 | 4.64 | 12.31 | 1.82 |
| Return on Invested Capital % | 7.15 | 8.7 | 17.39 | -8.72 | 7.58 | 11.71 | 8.84 | 4.69 | 9.92 | 2.15 |
| Interest Coverage | 4.58 | 5.55 | 9.92 | -4.47 | 2.35 | 5.29 | 7.31 | 3.32 | 8.89 | 1.49 |
Table: 4– profitability Ratios for Warrnambool Cheese and Butter Factory Co Holdings Ltd (Source: finance.yahoo.co.au)
Based on the company’s financials and profitability ratios, it can be understood that the company’s revenue increased by 8% in comparison to last year and gross margin increase by 19%, operating income increased by 3X, earning per share increased by 2X, working capital reduced by 10%, operating margin increased by 3X as compared to last year. This indicate that the company’s financial performance has increased historically. On other side, turnover ratio increased but the return over asset decreased a lot. The financial leverage ratio increased means the company has gone for more debt in recent years. The overall financial strength of the company is growing and is expected to sustainable in coming years.
Warrnambool Cheese and Butter factory has demonstrated high growth from the beginning of the establishment. The revenue of the company increased by 5% with gross margin of 22.25% and increase in operative income by 2X. The company’s turnover ratio and return on asset increased but financial leverage ratio decreased that indicates the company is doing pretty well and leading toward self-sustainability. Overall, the company is growing with 2X on an average.
Based on a top level and bottom level financial analysis it is possible to make recommendations for Bega Cheese and Warrnambool Cheese and Butter Factory. Now in terms of the top level analysis, the overall negative impact of the economic recessions is over for the food, beverage and tobacco industry. There are good opportunities for export, although a certain amount of flux in economic is seen in countries such as China, so Warrnambool Cheese and Butter Factory which sells more than 50 percent of its product to foreign countries must strategize its export partners better. It should have more diversified markets. Bega Cheese and Warrnambool Cheese and Butter Factory are both in an industry that is well supported by the Government and also educational research facilities. Therefore, it has a very supportive macro-economic environment.
References
Australian Government. (2015). Australian Industry Report, Retrieved Sep 22, 2016 at: http://www.industry.gov.au/Office-of-the-Chief-Economist/Publications/Documents/AIR2015.pdf
Smith, S. 2015. Warrnambool Cheese and Butter to buy Lion’s ‘everyday cheese business’, Retrieved Sep 22, 2016 at: http://www.weeklytimesnow.com.au/agribusiness/dairy/warrnambool-cheese-and-butter-to-buy-lions-everyday-cheese-business/news-story/8e947a0902dbe496d2faa455c3664f31
Bega Cheese, Retrieved Sep 22, 2016 at: http://www.begacheese.com.au/
Upload your Assignment and improve Your Grade
Boost Grades


